India is one of the fastest growing economies in the world and there has been a rapid increase in urbanisation, which has lead to enormous demand for buildings and therefore energy in the coming years. During 2013 – 2014 building energy consumption in India is 31% of the total electrical energy consumption of the country (Central Statistics Office, 2015). In 2001, the government of India enacted The Energy Conservation Act, 2001 (EC Act) with a goal to reduce the energy intensity of the Indian Economy. Bureau of Energy Efficiency (BEE) was set up as the statutory body at the central level to facilitate the implementation of the EC Act in the country. During the last decade, Ministry of Power through Bureau of Energy Efficiency (BEE), has initiated a number of energy efficiency initiatives in the areas of household lighting, new and existing buildings, standards and labeling of appliances, codes and standards for building design and constructions and energy rating for existing buildings in the country.
To scale up the growth in urban infrastructure across the country, the government has initiated innumerable initiatives to lift the infrastructure and construction sectors. To provide the core infrastructure and give a descent quality of life to its citizen the central government has recently launched smart cities mission, for this Government has earmarked INR 48,000 crore (EUR 6,541 million approximately) to develop 100 smart cities across the country. Other important initiatives include Jawaharlal Nehru National Urban Renewal Mission (JNNURM), Bharat Nirman Initiative, Urban Infrastructure Development Scheme for Small and Medium Towns (UIDSSMT) etc.
 Buildings Tab Buildings Tab |
 Policy Tab Policy Tab |
 Appliances Tab Appliances Tab |
|---|---|---|
| In the Buildings section, you will find an overview of the building sector, information on the bigEE Strategic Approach in India, country specific recommendations, and Good Practice examples from the various regions of India. | The Policy section will provide to you an overview and analysis of key policies and programmes the government of India has adopted to promote energy efficiency in buildings and appliances. | The Appliances section will illustrate national best available technologies (BAT), non-BAT appliances typically used in India as well as analyses of the potential costs and benefits of energy efficiency improvements. |
| Total population | 1,267,401,849 |
| Size | 3,300,000 km² |
| GDP (2015) | 2,066.90 USD Billion |
|---|---|
| GDP Per capita (2015) | 1,262.52 USD |
| GDP real growth rate (2015) | 7.00 % |
India is the second most populated country in the world and has a fast-growing economy with a corresponding growing energy demand.
| Existing Building Area (2011) | 11,627 Million m2 |
|---|---|
| Rate of Construction | Construction of an average 460 Million m2 of real estate space per year between 2012 and 2020 |
| GDP from construction | INR 2,377 Billion (EUR 32.29 Billion approximately) |
Globally buildings account for 40% (UNEP.org, 2016) of the total energy consumption. In India, the building sector accounts for approximately 33% of the total final energy consumption and is growing at a rate of 8% annually (Rawal et al., 2012; Central Statistics Office, 2015). The potential of reducing energy consumption is up to 60% using energy efficient technologies. It is therefore, critical that policy interventions are put in place to improve energy efficiency in both new as well as existing buildings.
With growth in the economy, urbanization is taking place rapidly in India and has increased from 26% in 1991 to 31% in 2010 and is expected to increase to 34% by 2015 and 36% by 2020. It is expected that by 2020, almost 500 million people will be living in urban India (Jones Lang LaSalle, 2011). Rapid urbanisation has led to an increase in the energy consumption in building sector. The commercial building sector accounts for 8% of total electricity consumption in buildings and has been growing at a rate of 11-12%, much faster than the average electricity growth in the economy (USAID ECO-III Project, 2010). The residential building sector accounts for 22% of the total electricity consumption and has been growing at a rate of 8%.
India is broadly divided into five climate zones. Climatic zone classification according to Energy Con-servation Building Code of India (ECBC) is shown in the map below (Bureau of Energy Efficiency, 2009).

Climate zone definition according to the Strategic Approach of the bigEE Project
The climate classification for the building sector within the bigEE project differs from that of the Indian Building Standard climate definition. The bigEE climate definition is that of a degree-day system. This is based on both the heating degree-days, cooling degree-days as well as the humidity. For simplicity the world’s climate was divided into four major climatic zones, Cold, Temperate (Note: this is not the same Temperate as in the climate definition for India according to the Indian Energy Building Standards), Hot and Humid and Hot and Arid. Each of these regions or zones has different requirements with respect to heating and cooling energy needs. The focus for energy-efficient measures therefore varies between different climatic regions.
| Climate Zone | Typical City or Region | Mean Temp. Coldest Month | Mean Temp. Hottest Month | CDD18°C | HDD18°C | bigEE Climate Zone |
|---|---|---|---|---|---|---|
| Hot and dry | Jaipur | 15.5 °C | 33.1 °C | ≥ 1000 | < 1000 | Hot and Arid |
| Warm and Humid | Mumbai | 23.7 °C | 29.7 °C | ≥ 1000 | < 1000 | Hot and Humid |
| Temperate | Bangalore | 20.7 °C | 27.1 °C | ≥ 1000 | < 1000 | Hot and Humid |
| Cold (Sunny/Cloudy) | Srinagar | 1.5 °C | 24.6 °C | ≥ 1000 | ≥ 1000 | Temperate |
| Composite | New Delhi | 14.2 °C | 34.3 °C | ≥ 1000 | < 1000 | Hot and Arid |

| Climate | Typical City or Region | CDD10°C | HDD18°C | Humidity hottest month |
|---|---|---|---|---|
| Cold | n.a. | < 1000 | ≥ 1000 | n.a. |
| Temperate | (e.g. Srinagar) | ≥ 1000 | ≥ 1000 | n.a. |
| Hot - Dry | (e.g. New Delhi, Mumabi, Bangalore) | ≥ 1000 | < 1000 | ≤ 50% |
| Hot - Humid | (e.g. New Delhi, Mumabi, Bangalore) | ≥ 1000 | < 1000 | ≥ 50% |


The biggest challenge while constructing a new building is getting the architect, the engineer, the contractor, the consultant on the common platform. In all the three phases of development, construction and operation of a building, there are several steps which are interlinked to each other. All these processes require involvement from different markets and stakeholders . In addition to various stakeholders such as owners, project team, construction worker, maintenance team, there are certain stakeholders which are not part of the value chain, but play an important role in influencing market decisions, such as public authorities, energy agencies, energy service companies etc. to name a few.
Buildings undergoing the retrofitting process are quite similar to the new construction building as they also involve same stakeholders, however, they may exclude certain specific tasks and actors of property development and sale or letting. Such renovation processes and actor constellations are thus almost as complex as those for new building.

| Property development | Property development companies (Social) Housing companies Investor-occupier |
Property development |
|---|---|---|
| Financing | Banks Equity funders Public-private partnership (PPP) Insurances Property valuers |
Financing |
| Design | Architects Engineering consultants |
Design |
| Component supply | Component manufacturers Wholesale and retail |
Component supply |
| Construction | General management companies Construction companies and contractors Manufacturers of pre-fabricated houses |
Construction |
| Installation of systems | System suppliers Installation contractors |
Installation of systems |
| Sale/Letting | Property development companies (as sellers or landlords) Manufacturers of pre-fabricated houses Housing corporations Real estate agents Landlords/landladies Buyers, tenants |
Sale/Letting |
| Commissioning | Commissioning providers Engineering consultants Facility managers |
Commissioning |
| Operation/Use | Investor-occupiers (as developers or as buyers of completed buildings) Landlords/landladies Tenants Employees, customers, visitors, guests etc. Facility managers |
Operation/Use |
The life-cycle phase of an energy-efficient appliance, involves a large number of different market actors like manufacturers, retailers, wholesale companies, investors, and users. As with buildings, there are also some actors that are not part of the value chain for appliances itself, but nevertheless have an important role to play in influencing the decisions of the market actors - for instance: public authorities, energy agencies, research institutes, and interest groups.
The following figure illustrates how the relevant actors in the appliances value chain interact in the different life cycle phases of appliances. The arrows demonstrate the supplier relations. On the right side of the figure, you can see the influencing actors, which have possibilities to influence the design, manufacturing, sale, or use of the product. Different actors can influence the energy consumption of appliances via the governance framework, research and development activities or energy efficiency advice and other measures.

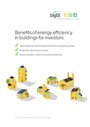
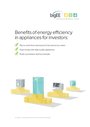
makes energy efficiency in buildings and appliances transparent. For investors, policy-makers and actors involved in implementation and consultancy. Learn more ...


 Buildings Guide
  Policy Guide
  Appliances Guide
  India
India South Africa