The cost of a solar PV system includes the cost of the solar PV panel, inverter, energy storage, other BOS electrical components, charge and systems controller, installation costs and system maintenance costs. The cost of all these components varies depending on the country and technology available. Cost of the system also depends on whether it is grid connected or hybrid system, as battery storage being the significant additional cost in the latter. Typically the costs can be described as cost per rated DC peak power output (€/Wp) of the PV panel.

Cost of solar PV module
Cost of solar PV module depends on the technology being used such as c-Si, CdTe, module efficiency etc. Among other factors such as the cost of production, material availability, transport costs etc. PV module costs also reduce rapidly with growth in the PV market. The absolute cost and structure of PV modules varies by technology. Conventional c-Si PV modules are the most expensive PV technology, with the exception of CPV modules, but they also have the highest commercial efficiency. However, other PV modules are approaching the efficiency levels of c-Si modules and are cheaper. Figure above illustrates average worldwide PV module cost structures by technology (IRENA, 2012).
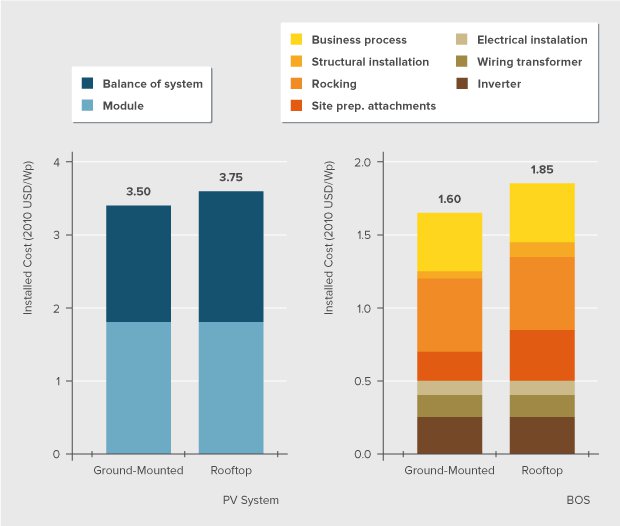
Cost of PV system (including PV panel and BOS)
The Balance Of
System components are highly dependent on the prices in the individual
countries of various components. This price is dependent on the
technological superiority of some components like inverters,
controllers, storage bank and material costs involved in wiring and
mounting and labour costs involved in installation and operation and
maintenance (for example, see figure below). The price of the system
also depends on the size of the system where economies of scale come
into play. Typically small-scale residential and commercial rooftop PV
systems cost higher per installed Wp than Utility scale systems.
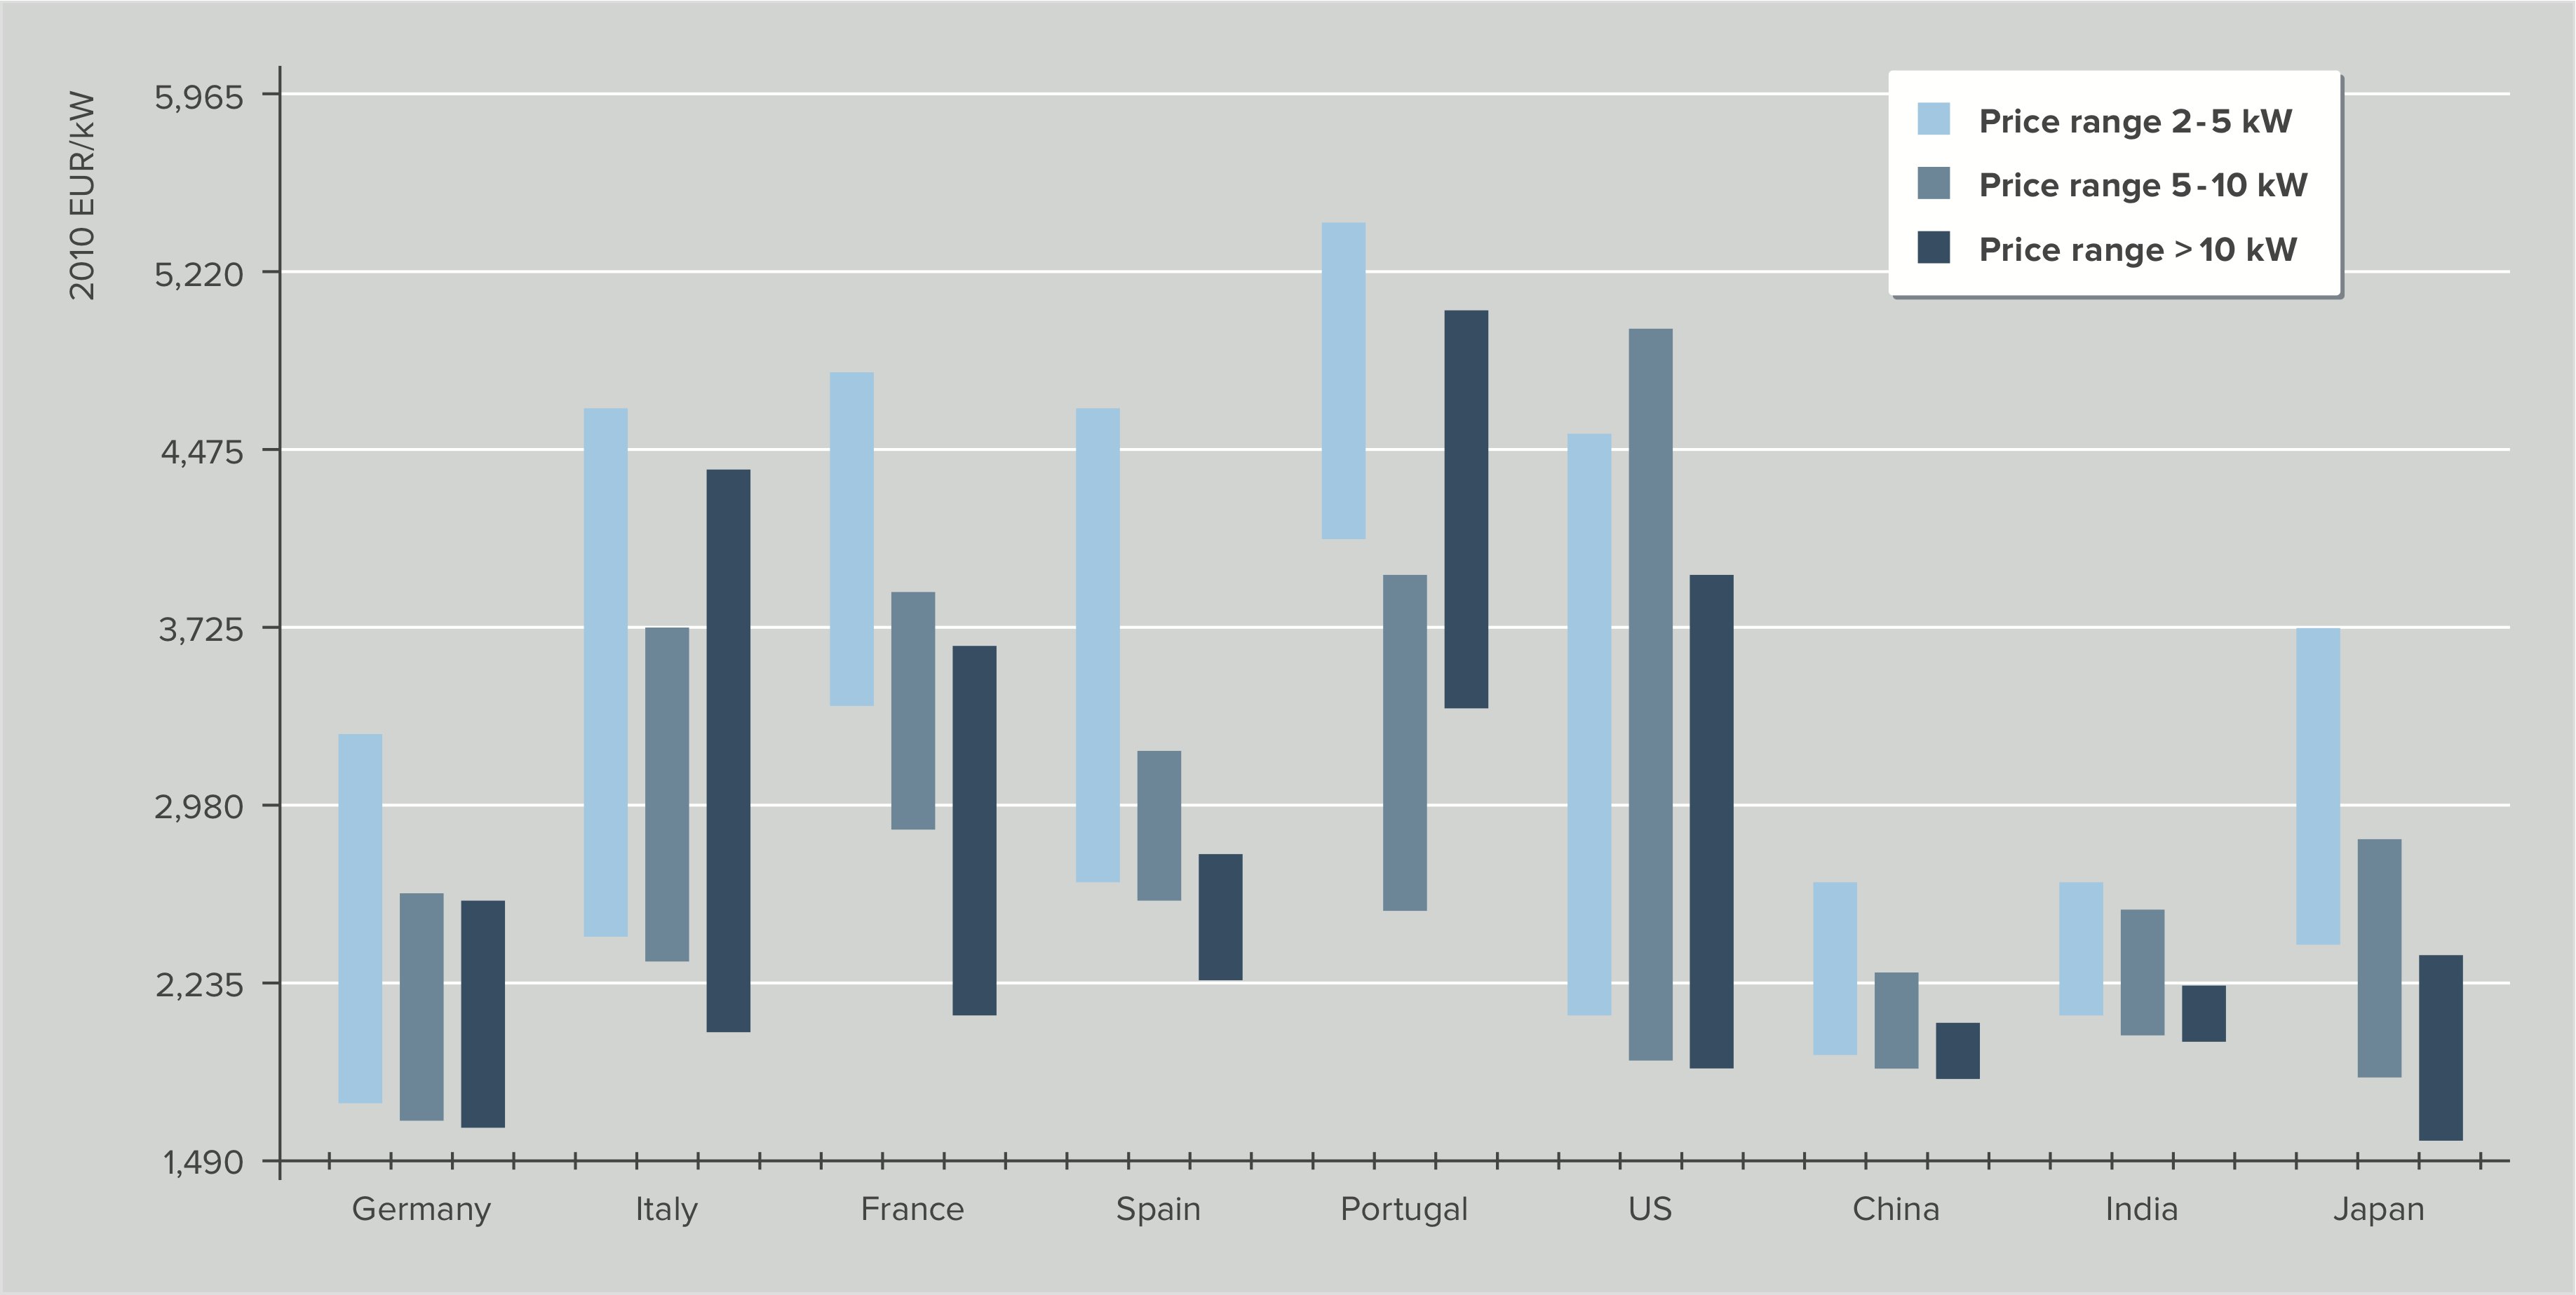
Regional variations in cost
However, regional variations play an important factor in determining the price as can be seen in the figure below.
Levelized Cost Of Electricity (LCOE) gives an estimate of the cost effectiveness of PV system over a period of time compared to other generation technologies. Key factors that affect the payback time are the prevailing energy utility charges, the cost of PV technology available and the capacity factor (determines energy generation at normalized full capacity hours). A typical building integrated PV installation will have a lifetime of approximately 25-30 years although at a reduced efficiency over the years.
A quick and rough LCOE analysis of building integrated PV systems has been performed from the data based on IRENA and Photon, 2011, based on electricity prices from open source data using a calculator tool developed by NREL. This gives an impression of cost effectiveness of PV systems in those particular countries, for some key parameters.
| Country | PV system installation cost in €/kWp | Electricity price from supplier (€cent/kWh) | LCOE of electricity price (€cent/kWh) | LCOE from PV system (€cent/kWh) | €cent/kWh saved |
|---|---|---|---|---|---|
| Germany | 2,235 | 26 | 37.1 | 13.2 | 23.9 |
| Italy | 2,980 | 20 | 28.5 | 15.6 | 12.6 |
| France | 3,500 | 14 | 19.9 | 17.3 | 2.6 |
| Spain | 2,980 | 16 | 22.8 | 15.6 | 7.2 |
| Portugal | 4,200 | 18 | 25.7 | 19.6 | 6.1 |
| USA | 2,980 | 20 | 28.5 | 15.6 | 12.6 |
| China | 2,000 | 08 | 11.4 | 12.4 | -1.0 |
| India | 2,235 | 08 | 11.4 | 13.2 | -1.8 |
| Japan | 2,235 | 14 | 19.9 | 13.2 | 6.7 |
It can be observed from the above table that lower first investment costs and higher prevailing utility rates only result in the promotion of PV system installations. In countries with lower prevailing utility rates, e.g., China and India subsidies are needed to further lower the first investment costs.
Besides, LCOE, feed in tariffs also play an important role in analysing the cost benefit analysis of a PV system. Since all the electricity produced cannot be always used and stored, surplus energy at peak generating times must be supplied back into the grid. The electricity that is supplied back is brought by the grid at a fixed price called Feed in Tariff (Fit). A feed in tariff matching or exceeding the prevailing utility rate acts a further incentive to install PV generation systems.
The following table shows FiT for building integrated PV installations (including rooftops) and prevailing utility price in few countries (subject to contracts, typically for 20 years, data ca 2010 and 2011).
| Country | Utility price (€cent/kWh) | Feed in Tariff (FiT) (€cent/kWh) | Difference (€cent/kWh) |
|---|---|---|---|
| Germany | 26 | 13 | -13 |
| England, UK | 12-20 | 15-17 | -3 |
| France | 10-15 | 13-28 | -3 - -13 |
| USA (California) | 20 | 28 | 8 |
| China | 08 | 11 | 3 |
| India | 08 | 21 | 13 |
makes energy efficiency in buildings and appliances transparent. For investors, policy-makers and actors involved in implementation and consultancy. Learn more ...


 Buildings Guide
  Policy Guide
  Appliances Guide
  India
India South Africa